Every organization I walk into has the same disease: numbers used as adjectives. Revenue is “strong.” Churn is “concerning.” Pipeline is “healthy.” The numbers sit on slides like garnish on a plate—decorative, inert, and removed before anyone eats.
This is not a data problem. It is a language problem. When a number modifies a noun instead of driving a verb, it has become an adjective. And adjectives are the enemy of decision-making.
The distinction matters because adjective-numbers absorb budget. They require pipelines, dashboards, analysts, and infrastructure—all to produce a decoration that changes nothing. The number exists, the slide is “data-driven,” and the meeting ends with the same decision that would have been made without it.
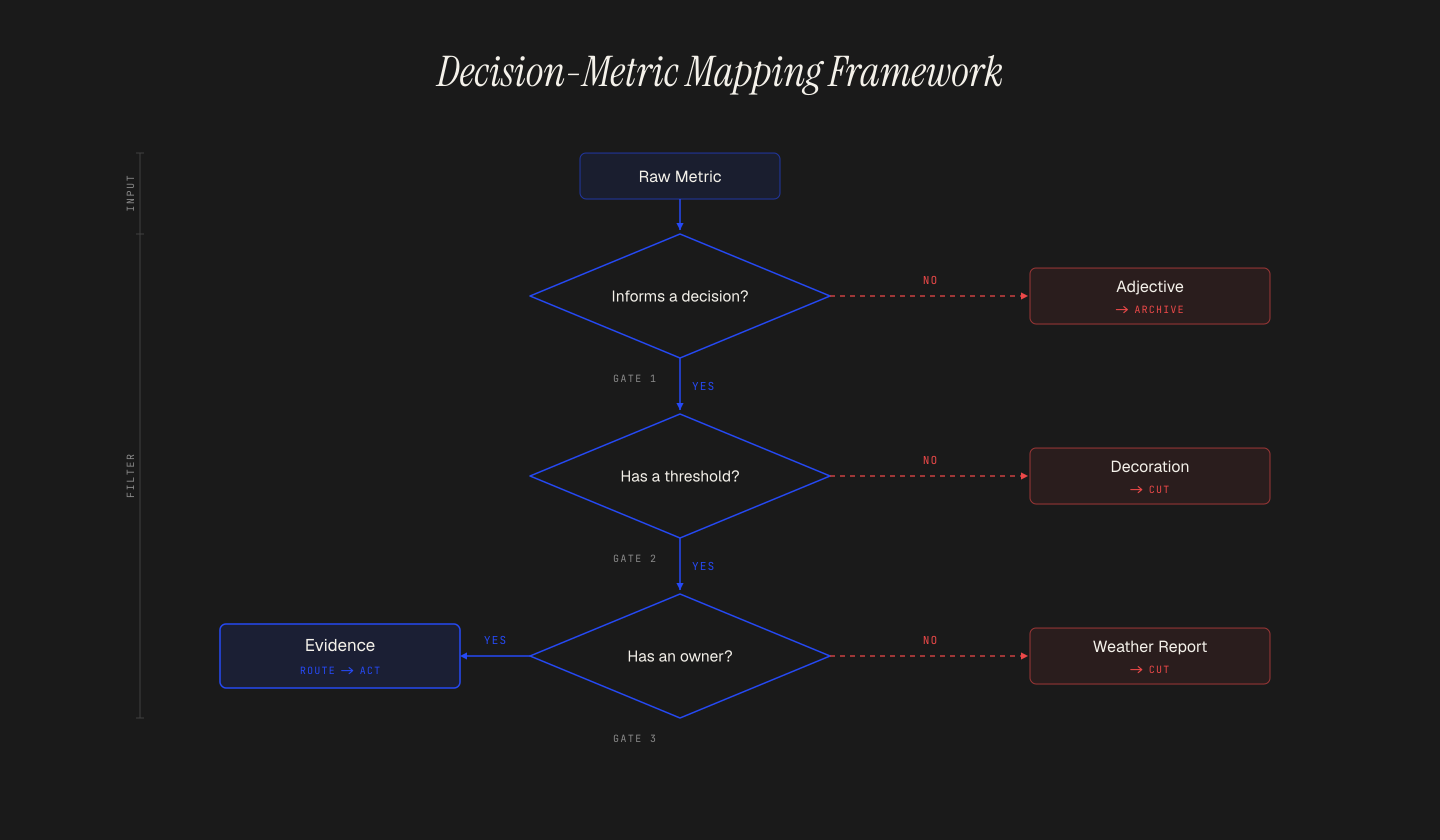
The adjective test
Before any number earns real estate on a slide, in a dashboard, or in an executive summary, it must survive three questions:
- What decision does this number inform? If the answer is “none specifically,” the number is an adjective.
- What threshold triggers action? If there is no threshold—no line in the sand that changes behavior—the number is decorative.
- Who owns the response? If no one is accountable for acting when the number crosses its threshold, you have built a weather report, not an operating system.
A dashboard is not a deliverable. A dashboard is a hypothesis about what information will change behavior. Most hypotheses are wrong.
What this means for your stack
If you accept this framing, the implications for data infrastructure are immediate and uncomfortable:
- Kill the vanity layer. Any metric without a decision, threshold, and owner gets archived. Not deprecated. Archived. Gone from the UI.
- Denominator before numerator. Before you build a new metric, define what “good” looks like. If you cannot state the denominator, you are not ready to measure the numerator.
- Action-routing over visualization. The highest ROI data work is not a better chart. It is a system that routes the right number to the right person at the right time with the right context to act.
- Fewer dashboards, more decision logs. Track what decisions were made, what data informed them, and what happened next. This is your real analytics maturity signal.
The uncomfortable part
Most data teams do not want to hear this. They have spent years building the infrastructure, the pipelines, the dashboards. The suggestion that much of it is decorative feels like an accusation. It is not.
It is a reframing. The work was not wasted—it built the muscle. But the muscle has been flexed in service of adjectives. The next phase is using that same infrastructure to drive verbs: to trigger, to route, to escalate, to resolve.
The test is simple. Look at your last board deck. For every number on every slide, ask: if I removed this number, would anything in this room change? If the answer is no, you have found an adjective. Cut it. Redeploy the effort toward a number that moves something.
Notes
- 1The “adjective test” framing originates from an internal operating memo I wrote for a logistics client in 2024. The three questions have since been adopted by their product and data teams as a gating mechanism for new metric requests.
- 2The 4/5 statistic is drawn from 23 dashboard audits conducted across seven organizations between 2022 and 2025. Sample skews toward mid-market B2B companies with 200–2,000 employees.